K2E Canada Inc
  • Home
  • TRAINING
    • WEBINARS
    • ROAD TO EXCELLENCE ONLINE SEMINAR
    • SEMINARS
    • TECHNOLOGY CONFERENCE
    • INSTRUCTORS
  • NEWSLETTER
    • Signup
  • ABOUT
  • CONTACT
  • BLOG
  • Home
  • TRAINING
    • WEBINARS
    • ROAD TO EXCELLENCE ONLINE SEMINAR
    • SEMINARS
    • TECHNOLOGY CONFERENCE
    • INSTRUCTORS
  • NEWSLETTER
    • Signup
  • ABOUT
  • CONTACT
  • BLOG

Forecast Sheet and Forecast.ETS

2/8/2021


Forecast Sheet

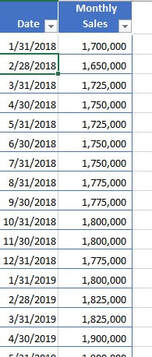
Excel’s Forecast Sheet feature not only creates forecasted values that account for seasonality, but it also can provide confidence boundaries around the forecasted values and create forecasted values for multiple future periods. Using the data shown below begin by clicking in the data you wish to use as the foundation for your forecast sheet. The data requires a time line with a consistent interval and corresponding values.  Up to 30% of intervals can be missing and the Forecast Sheet will still be accurate.
Picture
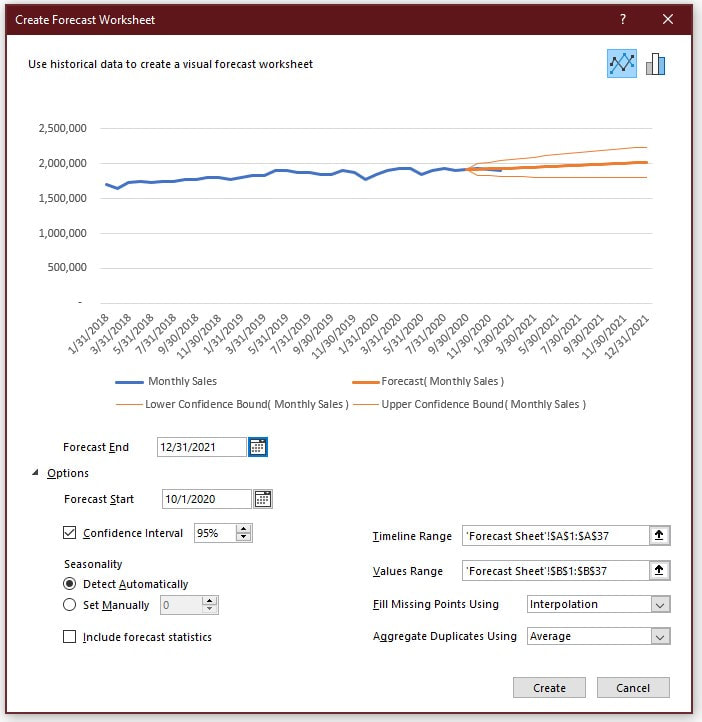
Next, click Forecast Sheet on the Data tab of the Ribbon. In the ensuing dialog box (shown below), make any adjustments necessary for the time periods, confidence level, etc. and click Create to build the Forecast Sheet. 
Picture

Clicking Create results in a new sheet being created to the left of the data sheet with a copy of the data, the results of the forecast, and a chart of the forecast. This is a copy of the data and any changes to the data will not be reflected in the forecast. To make any changes to your selections in the dialogue above you will have to edit the formulas in the forecast sheet or run the Forecast Sheet command again.
Picture


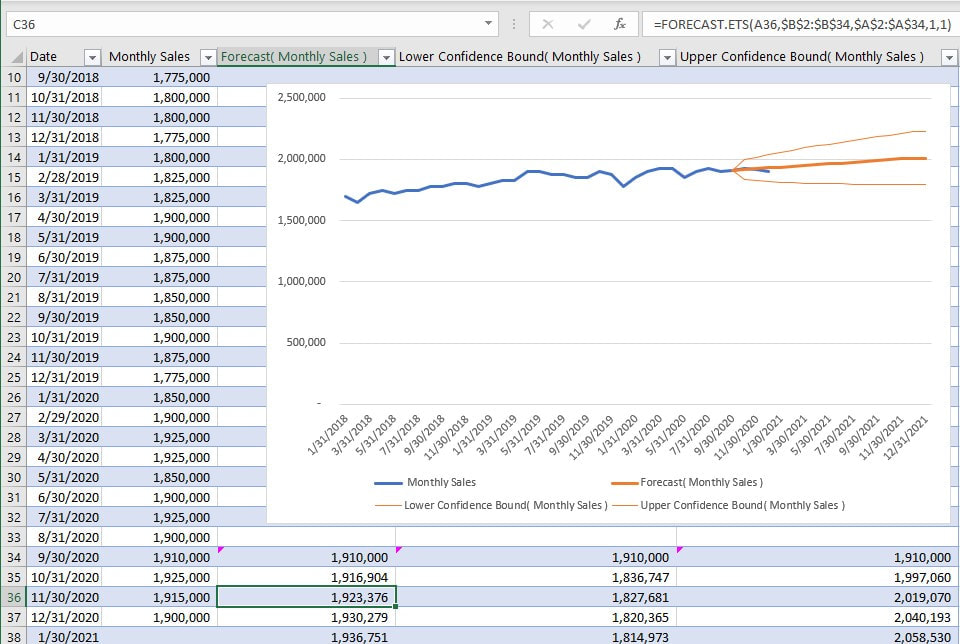
The FORECAST.ETS Function

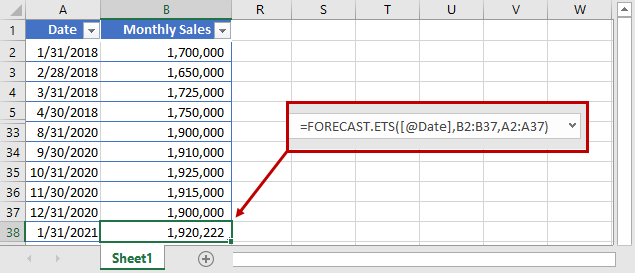
The Forecast Sheet results above use the FORECAST.ETS as shown in the screen shot above. This function is an improvement over the FORECAST function which provided only linear forecasting capabilities. With FORECAST.ETS, you can now generate forecasts with exponential smoothing. The primary benefit to using the FORECAST.ETS function is that its exponential smoothing capacity allows you to create forecasts that account for seasonality in your data. To illustrate, consider the data below (with multiple rows hidden for presentation purposes). In it, a formula that uses the FORECAST.ETS function is computing forecasted sales for January 2021. Notably, because this formula employs the FORECAST.ETS function instead of the FORECAST function, it accounts for seasonality in the data. 
Picture
forecast_sheet_and_forecast.ets.xlsx
File Size: 32 kb
File Type: xlsx
Download File

Ward Blatch


Comments are closed.

    Categories

    All
    2022
    Accountant
    Accounting Software
    Accounting Solutions
    Adobe
    Advisory
    AI
    Artificial Intelligence
    Automation
    Backup
    Bitcoin
    Blockchain
    Business Automation
    Business Continuity
    Business Intelligence
    Business Management
    Cloud Computing
    Collaborate
    Collaboration
    Colonial
    Computer
    COVID 19
    COVID-19
    CPA
    CRM
    Cryptocurrency
    Customer Relationship Management
    Cybersecurity
    Cyptocurrencies
    Dext
    Doc.It
    Ecommerce
    Emerging Technologies
    Entrepreneurs
    Excel
    Forecasting
    Forecast Sheet
    Google
    Grammarly
    HR
    Internal Controls
    Internal Priorities
    KPIs
    LET
    Links
    Management Reports
    Microsoft 365
    Microsoft Office 2021
    Microsoft Teams
    Office
    Office 365
    Online Shop
    Outsourcing
    Pandemic
    Paperless
    Personal Computer
    PivotTables
    Power Automate
    Power BI
    PowerPoint
    Productivity
    QuickBooks
    Quickbooks Online
    Ransomware
    Receipt Bank
    Remote Work
    RPA
    Sage 50
    Security
    Small Business
    Small Business Accounting
    Small Business Accounting Software
    Stockhistory
    Technologies
    Technology
    Tech Update
    Windows
    Windows 10
    Windows 11
    Word
    Work At Home
    Workflow
    Work From Home
    Xcm
    Zoho
    Zoho CRM

    Authors


    Ward Blatch
    Ward provides consulting and training services as the Managing Director of K2E Canada Inc. He joined K2E Canada in 2005 and is responsible for the Canadian operations of this international consulting group, which provides professional development technology education for accountants across Canada and the US. Ward lives in rural Nova Scotia and can be reached at ward@k2e.ca.

    Tommy Stephens
    Tommy is one of the shareholders in K2 Enterprises, affiliating with the Firm in 2003 and joining as a shareholder in 2017. At K2, Tommy focuses on creating and delivering content and is responsible for many of the Firm's management and marketing functions. Tommy resides in the metro Atlanta area. You may reach him at tommy@k2e.com.

    Randy Johnson
    Randy is a nationally recognized educator, consultant, and writer with over 40 years experience in Strategic Technology Planning, Accounting Software Selection, Paperless, Systems and Network Integration, Business Continuity and Disaster Recovery Planning, Business Development and Management, Process Engineering and outsourced managed services. Randy can be reached at randy@k2e.com


    Bernie Smith
    Bernie coaches businesses to develop meaningful KPIs and present their management information in the clearest possible way to support good decision making. As the owner of Made to Measure KPIs, he has worked with major organisations including HSBC, Airbus, UBS, Barclays, Credit Suisse, Lloyds and many more.

    RSS Feed

Training & Education

Webinars
Road to Excellence Online Seminar
Seminars
Conferences
Instructors

Tech News

K2E Canada's Tech Update Newsletter

More

Privacy Policy
About
Contact

K2E Canada Inc.  |  484 Scarlett Crescent  |  Burlington, ON L7L 5M2  |  (905) 633-9772
© 2023 K2E Canada Inc. ALL RIGHTS RESERVED.