
Recently added to Excel is the new STOCKHISTORY function. You can use this function to retrieve historical prices for stocks as of a given date or range of dates. Read on, and you will learn how to use this feature to query historical securities prices into an Excel workbook.
Introducing STOCKHISTORY
Excel’s STOCKHISTORY function is finally rolling out to subscription-based versions of Excel. Unfortunately, this function is not yet available with perpetual licenses of Excel, such as Excel 2016 and Excel 2019. Presumptively, Microsoft will add the function to the next new version of Excel.
With this feature, you can retrieve historical stock prices for stocks by simply entering a few variables into a formula. Moreover, you can retrieve values for a single date or a range of dates. Further, if you choose a range of dates, you can designate daily, weekly, or monthly intervals. STOCKHISTORY displays date and closing price by default. However, you can optionally choose to show opening price, high price, low price, and volume if desired.
With this feature, you can retrieve historical stock prices for stocks by simply entering a few variables into a formula. Moreover, you can retrieve values for a single date or a range of dates. Further, if you choose a range of dates, you can designate daily, weekly, or monthly intervals. STOCKHISTORY displays date and closing price by default. However, you can optionally choose to show opening price, high price, low price, and volume if desired.
Using STOCKHISTORY
The syntax for using the STOCKHISTORY function is relatively simple, as indicated below. However, note that of the arguments available, only the stock and start_date are required. Thus, a formula using STOCKHISTORY could be as simple as =STOCKHISTORY(“MSFT”,“1/29/2021”). Of course, this formula returns the closing price for a share of Microsoft stock on January 29, 2021.
Additionally, you can create more sophisticated formulas using STOCKHISTORY if your needs require additional information. Specifically, the full syntax of a formula can include all the following items.
STOCKHISTORY(stock, start_date, [end_date],[interval],[headers], [property0], [property1] [property2], [property3], [property4], [property5])
Extending the previous example, we can create more powerful formulas that use the new function. For instance, we can use the following formula to use the STOCKHISTORY function to generate a listing of closing prices for a range of dates:
Additionally, you can create more sophisticated formulas using STOCKHISTORY if your needs require additional information. Specifically, the full syntax of a formula can include all the following items.
STOCKHISTORY(stock, start_date, [end_date],[interval],[headers], [property0], [property1] [property2], [property3], [property4], [property5])
- stock: The identifier for the financial instrument targeted. This reference can be a ticker symbol or a Stocks data type.
- start_date: The earliest date for which you want information
- end_date (optional): The latest date for which you want information
- interval (optional): Daily (0), Weekly (1), or Monthly (2) interval options for data
- headers (optional): Specifies if the formula returns additional header rows with the array
- property0 – property5 (optional): Specifies which information to include in the result, Date (0), Close (1), Open (2), High (3), Low (4), Volume (5).
Extending the previous example, we can create more powerful formulas that use the new function. For instance, we can use the following formula to use the STOCKHISTORY function to generate a listing of closing prices for a range of dates:
=STOCKHISTORY(“MSFT”,“1/1/2020”,“12/31/2020”)
To illustrate, Figure 1 below provides an abbreviated set of results from the formula shown above.
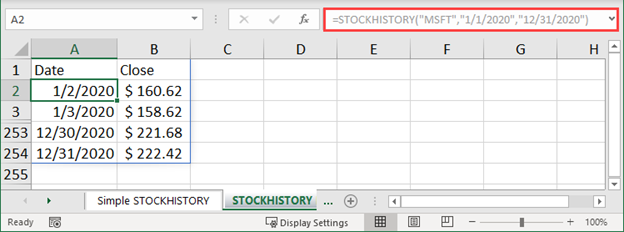
Figure 1 - Sample Results Using STOCKHISTORY
Another Example of STOCKHISTORY
Next, the ensuing example of the STOCKHISTORY function incorporates optional arguments to add columns for the Open price, High price, Low price, and Volume for each trading interval.
=STOCKHISTORY(“MSFT”, “1/1/2020”, “12/31/2020”,,1,0,1,2,3,4,5)
For example, Figure 2 illustrates an abbreviated set of results using this formula.
=STOCKHISTORY(“MSFT”, “1/1/2020”, “12/31/2020”,,1,0,1,2,3,4,5)
For example, Figure 2 illustrates an abbreviated set of results using this formula.
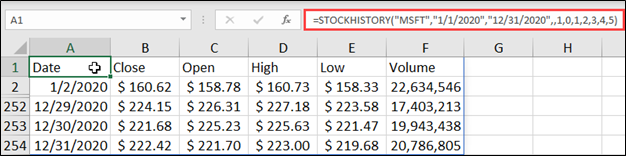
Figure 2 - STOCKHISTORY with Optional Arguments
Of course, you can use STOCKHISTORY results in the same fashion as if you entered the data manually.
Summary
In short, STOCKHISTORY is one of the most widely-anticipated functions added to Excel in recent years. If you have a subscription-based version of Excel, you should already have access to this feature or receive access soon. Importantly, you can use STOCKHISTORY to retrieve stocks’ historical prices and incorporate them into other calculations in your spreadsheets. Therefore, the next time you need to perform research to obtain historical data about a stock, consider using STOCKHISTORY. Most importantly, if you do, you will reduce the amount of time you spend retrieving data.
You can learn more about STOCKHISTORY and other Excel features and functions by participating in a K2E Canada Inc. training class. Additionally, you can learn more about STOCKHISTORY by reading this Microsoft article.
 RSS Feed